When I was younger, I was always fascinated by the amazing strides of space exploration technology. Voyager 1 and Voyager 2 were the pinnacle of human achievement in my opinion. It has been a long time since I reviewed their journey. I watched a YouTube video summarizing the achievements of these two amazing space probes.
Voyager 1 and Voyager 2 are special. They are the furthest objects that humans have sent into the solar system. They are even more special in my mind because they are overachievers. According to the video, the Voyagers were supposed to last for five years, but then their mission was extended to twelve years. Forty plus years later, the Voyagers are still transmitting data. However, we’ll be lucky to get another ten years out of them. Their main power source is set to run out in the next few years. Overall, the Voyager missions have got to be the most efficient use of taxpayer dollars ever!
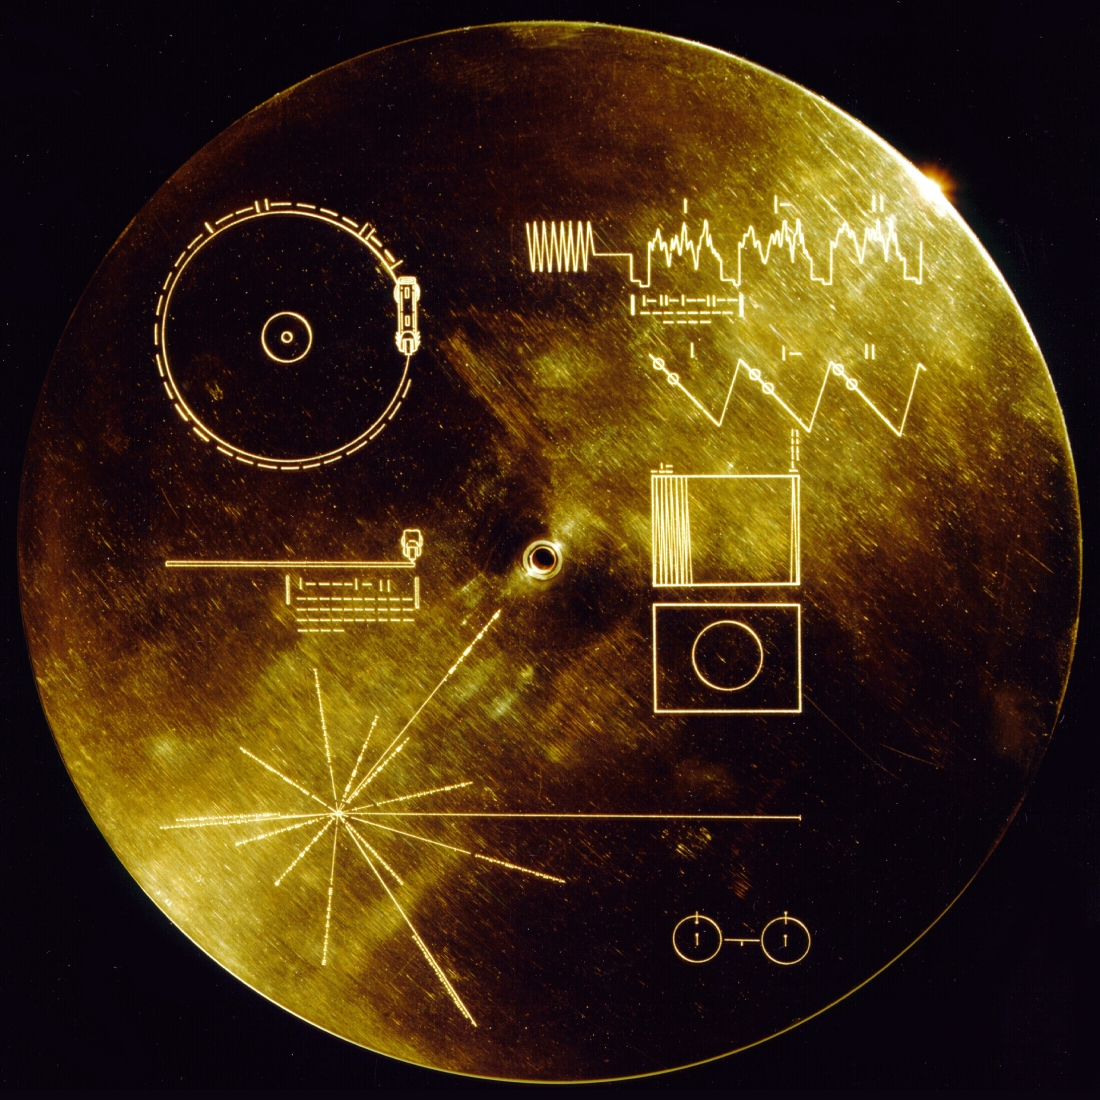
The video provided facts about the Voyagers that I never knew about. Onboard the Voyagers are gold records with sounds from Earth and a map to Earth. The records were also etched with Uranium-238, which has a half-life in the billions of years. Basically, the records will be playable for many years to come. Apparently, NASA was thinking about potential alien civilizations potentially meeting the Voyagers!
The Voyager missions will always be special in my mind. Currently, I feel as if there is a lack of grand space expeditions that will ever meet the Voyager standards. I feel some excitement with what Elon Musk is doing with SpaceX, but it doesn’t compare to the excitement I felt when I first learned about the Voyagers. We’ll see if there are any more missions that will match the success of the Voyagers, but until then, the Voyagers will remain the best engineering feat in my mind.
The records placed on the Voyager space crafts Picture from Wikipedia
The hot core of the Earth is known to provide the driving force behind plate tectonics, a process that constantly refreshes the crust of the Earth and creates many of the geological features inhabitants of this planet enjoy. Additionally, the hot core of the Earth combined with the relatively rapid rotation of this planet creates the magnetosphere that protects us and our precious atmosphere. The core of the Earth is heated in part by radioactive decay of elements. This presents an issue, as decaying elements become less abundant as they decompose into their ingredients. When will the core of the Earth begin to lose the heat that enables the existence of our atmosphere?
To estimate the amount of uranium and thorium left inside of Earth, one must detect the rate of decomposition and work backwards from there, using known half life data about these well-studied elements. Researchers looking to find the expiration date of our planet must detect some of the most minuscule entities known to exist: antineutrino particles called geoneutrinos. Current instrumentation of our planet is only able to detect around 16 geoneutrinos escaping the core of the Earth each year. This low sample size has proved insufficient for accurate calculation of the radioactive potential energy remaining below the Earth’s crust. New detectors are currently being constructed in Canada and China. These detectors, each the size of a small office building, must be built around a mile under the ground to shield from cosmic radiation. Estimated completion of the new detector network is early 2022. Researchers will then be able to calculate the amount that the planet has cooled since its birth, as well as the amount of fuel remaining in the core. Happily, none of the researchers anticipate this date to be soon. To learn more about the research being done to determine the thermal history and future of the planet, see this article in natureresearch journal.
The heat generated by radioactive decay in the Earth’s core slowly leaves through the crust. Source
Posted inClass|Taggedastro2110, blog3|Comments Off on How much is left in the tank?
One of the more peculiar parts of our universe is the presence of a great deal of mass that we cannot see. When looking at the gravitational effects on the mass in the universe, it is apparent that a significant amount of matter must be present but is not visible to us, leading to its subsequent naming, dark matter. The discovery of the accelerating expansion of the universe led scientists to believe that gravity must be counteracted in some way. Since the expansion of the universe is not slowing down with time, there must be some source of energy or force present that acts over such great distances. This mysterious fifth type of force was given the name dark energy. Although “dark” is not used in the same way as with dark matter, it is used here to indicate the lack of knowledge regarding the source of this energy and the mystery of how it propagates throughout space.
It has been commonly accepted in the scientific community that observable matter comprises about only 4-5% of the total mass of the universe. Thus, faced with this enormous discrepancy, the idea of invisible mass and a gravity-repelling force were incorporated to make sense of this confusion. Due to the relative modernity of this assertion and our technological limitations, there is little known about the specifics of both dark matter and dark energy. It will be interesting to follow the progression of research on these concepts and how our perceptions of spacetime and the universe change if further discoveries about dark matter/energy are made.
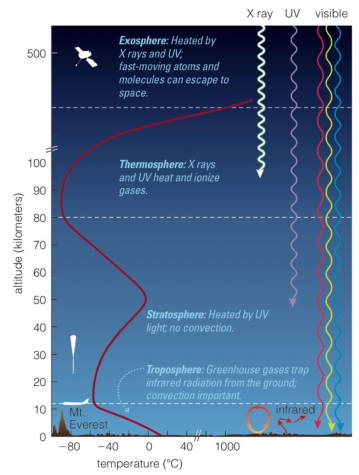
It is commonly believed that in locations of high altitudes, such as on the top of a mountain, the lower temperatures experienced are a caused by the lower atmospheric pressure that is present. However, this is not entirely the case. While the change in elevation is partially responsible for the decrease in temperature, the presence of greenhouse gases in the atmosphere has a significant effect as well. In the troposphere, the lowest level of Earth’s atmosphere, temperature decreases a relatively constant rate as altitude increases. Although, the relationship (evident in the graph below) does not follow this trend as we continue moving up through Earth’s atmosphere. Heated by UV light in the stratosphere and both X-rays and UV in the thermosphere, it is apparent that temperature of the atmosphere does not change in a consistent manner as we progress upwards through the entirety of Earth’s atmosphere. Since roughly 80% of the mass of Earth’s atmosphere is contained in the troposphere, the infrared radiation emitted from the surface as a result of the Greenhouse effect is mostly absorbed at low altitudes. This leads to relatively warmer temperatures near the surface making temperatures at high altitudes seem even colder relative to sea level.
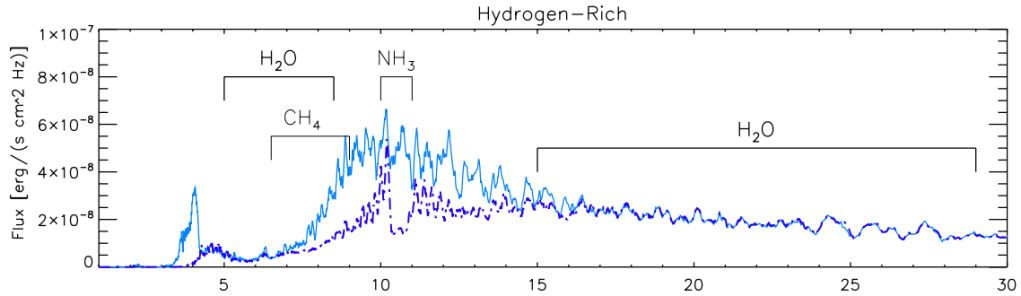
One goal of studying exoplanet atmospheres is to understand its composition and temperature. Specifically, we want to be able to recognize planets that could potentially have atmospheres most similar to Earth’s (with water vapor, oxygen, ozone, and carbon dioxide) – with the main objective being to find planets with strong water features that could support life. These planets, with strong water features, have a commonality in that they have atmospheres that are rich in hydrogen. So, it becomes important to distinguish these planets – that are rich in hydrogen – from planets that are poor in hydrogen (which are composed of mostly heavier molecules).
Fortunately, a significant finding is that transmission spectra are the best method for distinguishing between hydrogen-dominated and hydrogen-poor atmospheres. So, for example, if a star that is rich in hydrogen passes in front of a star; the starlight will actually filter through the planet’s hydrogen-rich atmosphere which will absorb certain wavelengths of light, causing a change in the resulting wavelength. We can then measure this change in the wavelength and use it to determine some of the elements that exist in the planet’s atmosphere. The results can then be plotted on a graph, and since the relative depth of spectral features in a planet’s transmission spectrum results in a direct determination of the atmospheric scale height; the scale height can also be used to determine planets that are made predominately of hydrogen, since they tend to be larger.
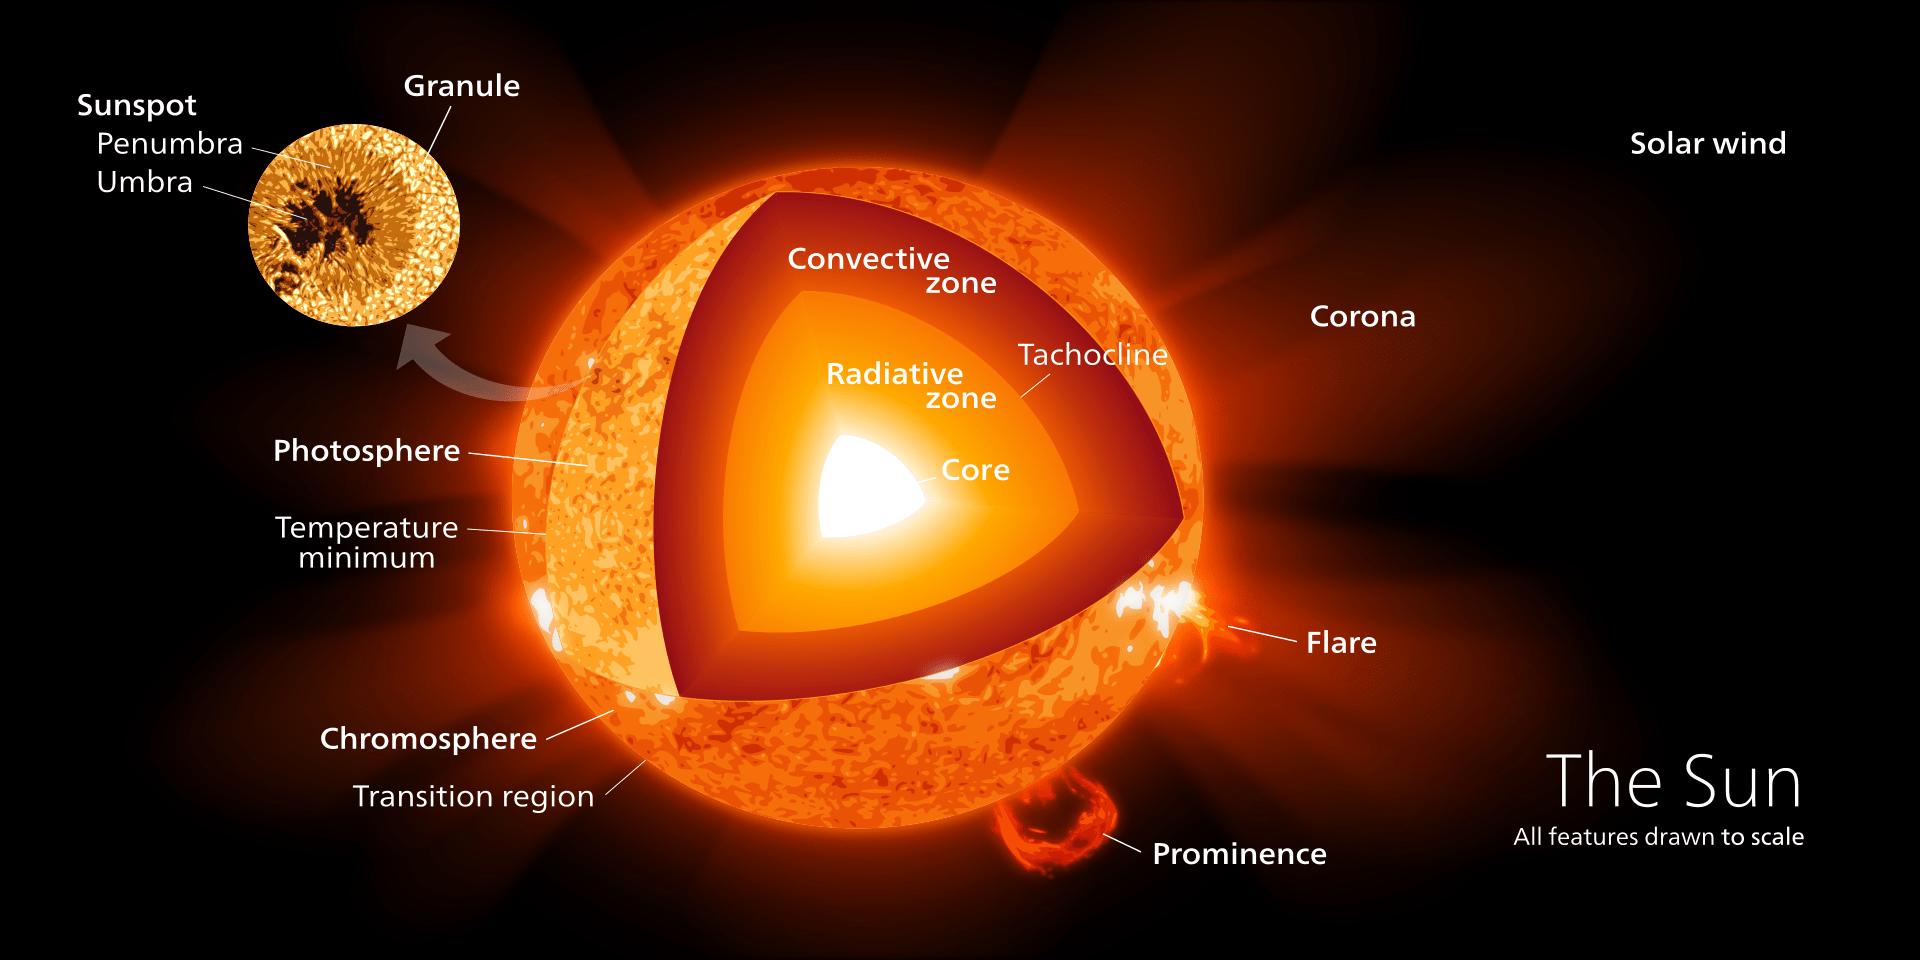
The Sun is the star at the center of the Solar System and is a nearly perfect sphere of hot plasma. Its diameter is about 1.39 million kilometers (864,000 miles) – 109 times that of Earth – and its mass is about 330,000 times that of Earth. The Sun accounts for about 99.86% of the total mass of the Solar System and its mass is comprised of hydrogen (~73%), helium (~25%), and other, much smaller quantities of heavier elements – including oxygen, carbon, neon, and iron. In terms of age, the Sun is roughly middle-aged and has not changed much for more than four billion years. Its core undergoes nuclear fusion whereby it fuses about 600 million tons of hydrogen into helium every second; the resulting energy (which can take between 10,000 and 170,000 years to escape from its core) is the source of the Sun’s light and heat.
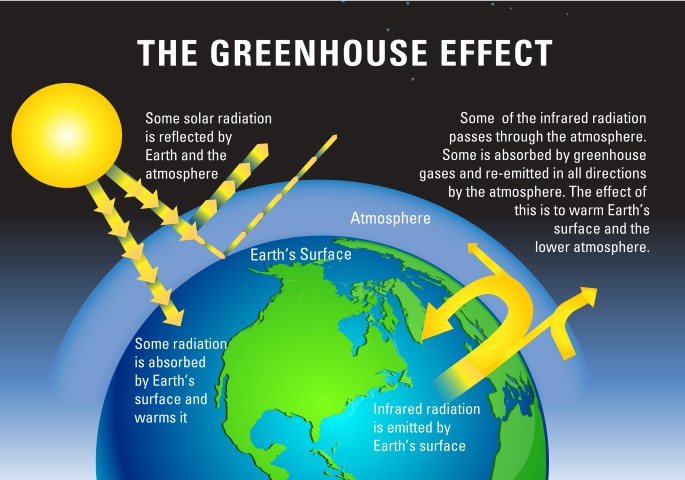
Earth experiences a warming through the greenhouse effect: the absorption and re-emission of light from the planet’s surface by compounds in the atmosphere such as carbon dioxide and water. Greenhouse gases are necessary for keeping life on Earth warm enough to survive, but an increase in their concentration has led to a undesirable heating of Earth.
A diagram illustrating the greenhouse effect on Earth, image courtesy of Environment
The greenhouse effect can be witnessed in your everyday life! We’ve all probably experienced a parked car that is extremely hot when you return to it, even hotter than the temperature outside. This can be explained by light, absorption, and a similar process as the diagram above depicts.
Visible light from the sun enters the car through the glass of the windows. Some of this light is reflected back out through the car as visible light, just like some visible light is reflected off Earth’s atmosphere back into space. But, like the greenhouse gases of the atmosphere, parts of your car absorb the visible light and then re-emit this light in the car. When the light is emitted, it is now in the form of infrared light, which cannot pass through the windows to escape and remains as heat. Overall, more energy is coming into the car than is able to escape, which results in the hot interior. The image below demonstrates what takes place within your car.
Visible light can enter and exit, but IR light (in the form of heat) cannot escape. Image from HyperPhysics
After seeing the discussion of spacecraft within our solar system in the textbook, and the impact the mission type has on the cost, I was curious to see how these discussions were reflected in actual data on these missions. So, I copied each mission from the book into Excel, and then researched each. Thanks mostly to Wikipedia and the Google search “How much did [MISSION NAME] cost?”, I came up with this table. Feel free to skip over it – the rest of the blog is more interesting.
Then, with all the boring data out of the way, I could make (relatively) pretty graphs to see how each part of the mission related to cost:
Cost and Mass
The most intuitive finding of this data is that more massive probes are (quite literally) exponentially more expensive:
This makes sense. Here, “mass” refers to the mass of the final probe (including propellant for any maneuvers once it’s in orbit). So, a heavier probe would need a bigger rocket to bring it to space. But this is constrained by something called the rocket equation, which (in very rough terms) says that as you increase the final mass of what you’re bringing to space, the total mass of your rocket has to increase exponentially. So it makes sense that, the more massive your final probe already is, the greater the marginal cost of another kilogram.
Cost by Probe Type
The book suggested that flybys are less expensive than orbiters which are less expensive than landers (and, presumably, stationary landers are less expensive than rovers). In practice, this isn’t reflected in the actual costs of these missions.
Rover
$1,490,865,000
Lander
$650,132,000
Orbiter
$1,471,548,000
Flyby
$1,796,605,000
Of course, none of this shows the inherent cost of each mission type. But it may indicate how much priority different projects are given. A rover will be driving all over a planet’s surface, so it makes sense to have a lot of gadgets to comb through all that data. And if the best you can do is fly by a planet, you only have one chance to collect a lot of data, so you need to make it worth it (perhaps with very expensive equipment). Landers, meanwhile, can’t see as far as an orbiter, so they can only do a handful of experiments.
Cost by Launch Year
The book didn’t discuss this directly, but I was curious if the price (adjusted for inflation) of missions within the solar system had come down. It has.
Excel’s trendline suggests that (after adjusting for inflation), the average cost of a mission within the solar system comes down by about $22 million every year. But looking at the data, a lot of this seems to be caused by the missions from 2000-2010. It’s hard to say how much of this “trend” is caused by changes in technology vs. changes in available funding vs. changes in mission designs.
Cost by Planet
We’ve sent missions to every planet in the solar system. I was curious which were most expensive.
Overall, missions to Saturn have been the most expensive on average. It’s not hard to come up with an explanation for why this could be. We’ve sent far more missions to Mars, and it’s cheaper to get back there. That means it may not be worth sticking everything you can on the ship and increasing the price. But with Saturn, it takes a lot just to get the rocket there. So if you have something going there, then everything to make the mission better – every extra hour of design, every special instrument to get more knowledge, every unique material to bring down the mass – becomes worth the cost. This doesn’t explain the trend in the opposite direction – that Mercury’s missions are cheaper than Venus’s, even though Venus is closer to Earth. That could be because we aren’t as interested in Mercury as we are Mars or Venus, but I really couldn’t say.
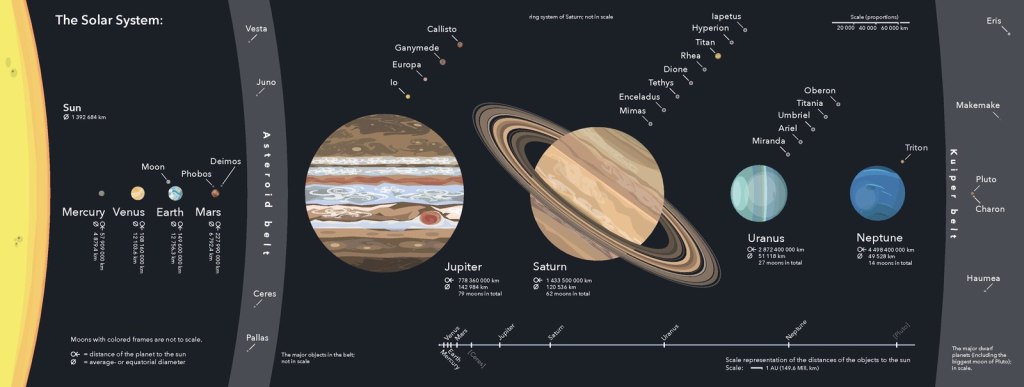
Composition of Solar System, picture from wikipedia
The solar system is a planetary system consisted of star Sun, planets, comets and other objects orbiting around the Sun, and Earth is one of them. The major mass of solar system is from the Sun. The sun is a G2 main-sequence star at the center of solar system which contains about 99.86% of total mass in solar system. The sun generates its heat and light through nuclear fusion. It’s 4.6 billion years old as the rest of the solar system is, and it will continue to last for about 5 billion years.
The next thing in solar system are planets. Mercury is the planet that is closest to sun, followed by Venus, Earth, and Mars. These four planets are called terrestrial planets as they are rocky, small in size with little moons.
Between the terrestrial planets and Jovian planets is the asteroid belt. It’s a Circumstellar disc occupied by numerous asteroids between Mars and Jupiter.
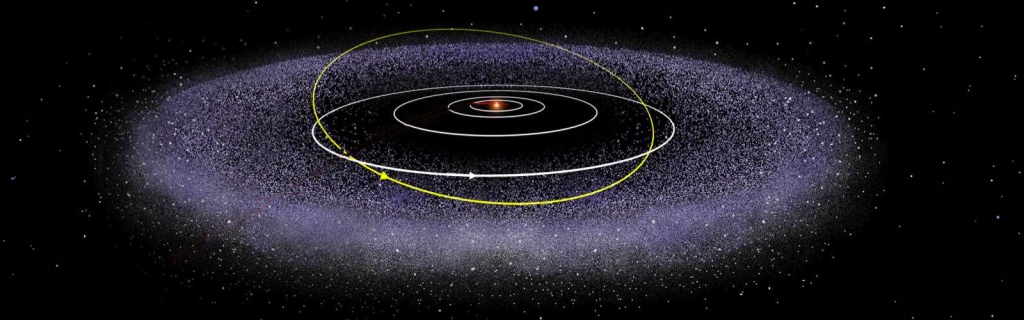
Jupiter, Saturn, Uranus and Neptune are called Jovian planet which are gaseous, giant, with a lot of moons. Beyond Neptune, it’s the Kuiper belt which is also a Circumstellar disc but it’s much larger in size than asteroid belt — 20 times wider and 20 to 200 times more massive. It’s occupied by asteroids which are remnants from when the solar system formed.
Because it is so technically difficult to reach Mercury with spacecraft’s from Earth, the geology of Mercury is understood the least of all the terrestrial worlds. The main reason it is so hard to reach is due to how close Mercury is to the Sun. When a spacecraft moves down Sun’s gravitational potential well to get closer to Mercury, its potential energy is converted to kinetic energy. In order to not pass by Mercury quickly, the spacecraft must rely completely on rocket motors to enter a stable orbit or land. This is very fuel intensive; in fact, a trip to Mercury from Earth requires more fuel than the amount required to escape the Solar System. I thought this was a very interesting piece of information to illustrate the concept of a potential well and just how much Sun’s gravity can affect space travel as objects travel closer to the Sun.
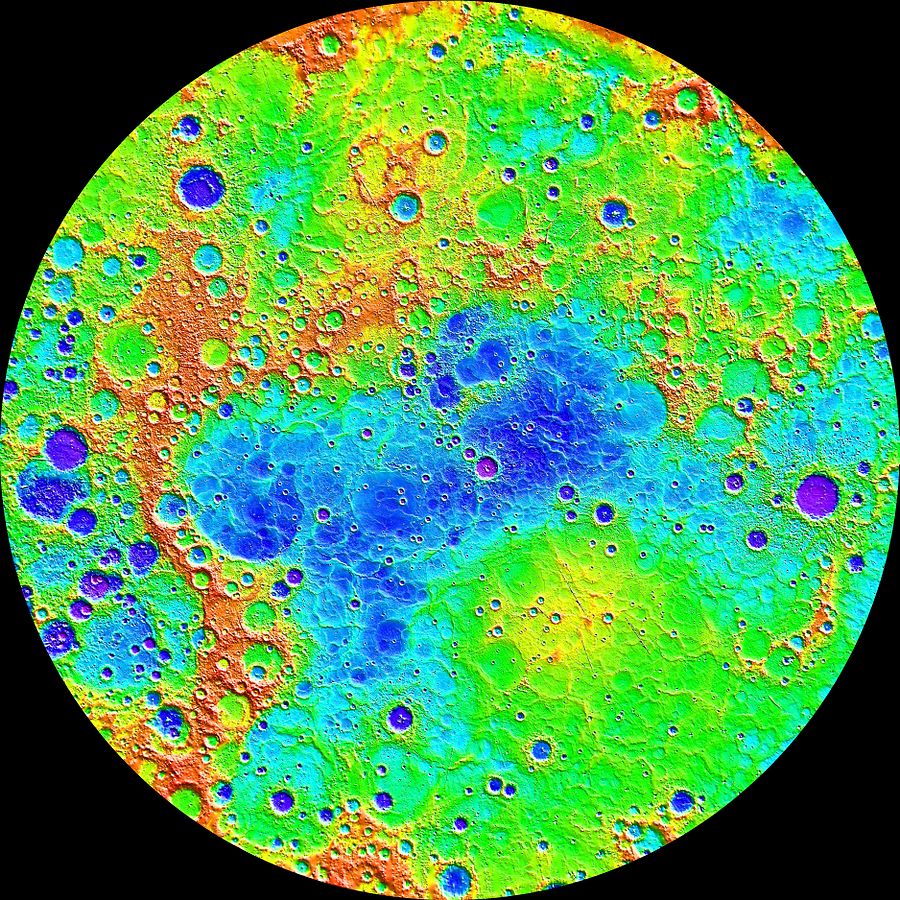
Since Earth-based observation of Mercury is made difficult because of its proximity to the sun, most of the information we have about Mercury’s geology is space-observed. All of the space-observed information we have about the geology of Mercury comes from two NASA space probes, the Mariner 10 (Nov 1973 – Mar 1975)and the MESSENGER (Aug 2004 – Apr 2015). Less than 45% of the surface was mapped after the Mariner 10 completed 3 separate flybys, but more than 99% of the surface was mapped after the MESSENGER successfully entered Mercury’s orbit in 2011.
The surface of Mercury is mainly made up of plains and impact craters, and is overall very similar to the moon in appearance. These were created as a result of flood volcanism, which occurred fairly early in Mercury’s geological history. There are also vents located on Mercury’s surface, and they are thought to be the source of magma-carved valleys. Fault scarps showing thrust faulting are found inside craters at the poles of Mercury. Based on what we know about Mercury’s density, it is implied that it has a solid iron-rich core that takes up about 75% of its radius. Its magnetic equator is shifted to the north nearly 20% of the radius, and this is thought to be caused by one or more iron-rich molten layers around the core or uneven weathering and deposition by solar wind. There has been an observed possibility of ice on Mercury’s poles, but this claim is not confirmed. If the ice observations are correct, astronomers believe that it must have originated from external sources like impacting comets.


